How to start with Insightarc Analytics
Intro.
This guide was written to help you build a customer journey in your product and find points where customers are stuck and leave the service.
We use the set of technologies helping you to
Discover hidden user traces per touchpoint based on data sources you have. As data sources could be used Web-analytic events (Goals, clicks), user actions from CRM (how customer journey throughout retail and back-office), and backend.
Find out issues underlying behind customer experience.
Analyse pain points on the large arrays of data. An average data set our users upload is 20 thousand user cases or about 1 million strings.
Let’s make the first result step by step.
Create an account. You can register via email or social accounts.
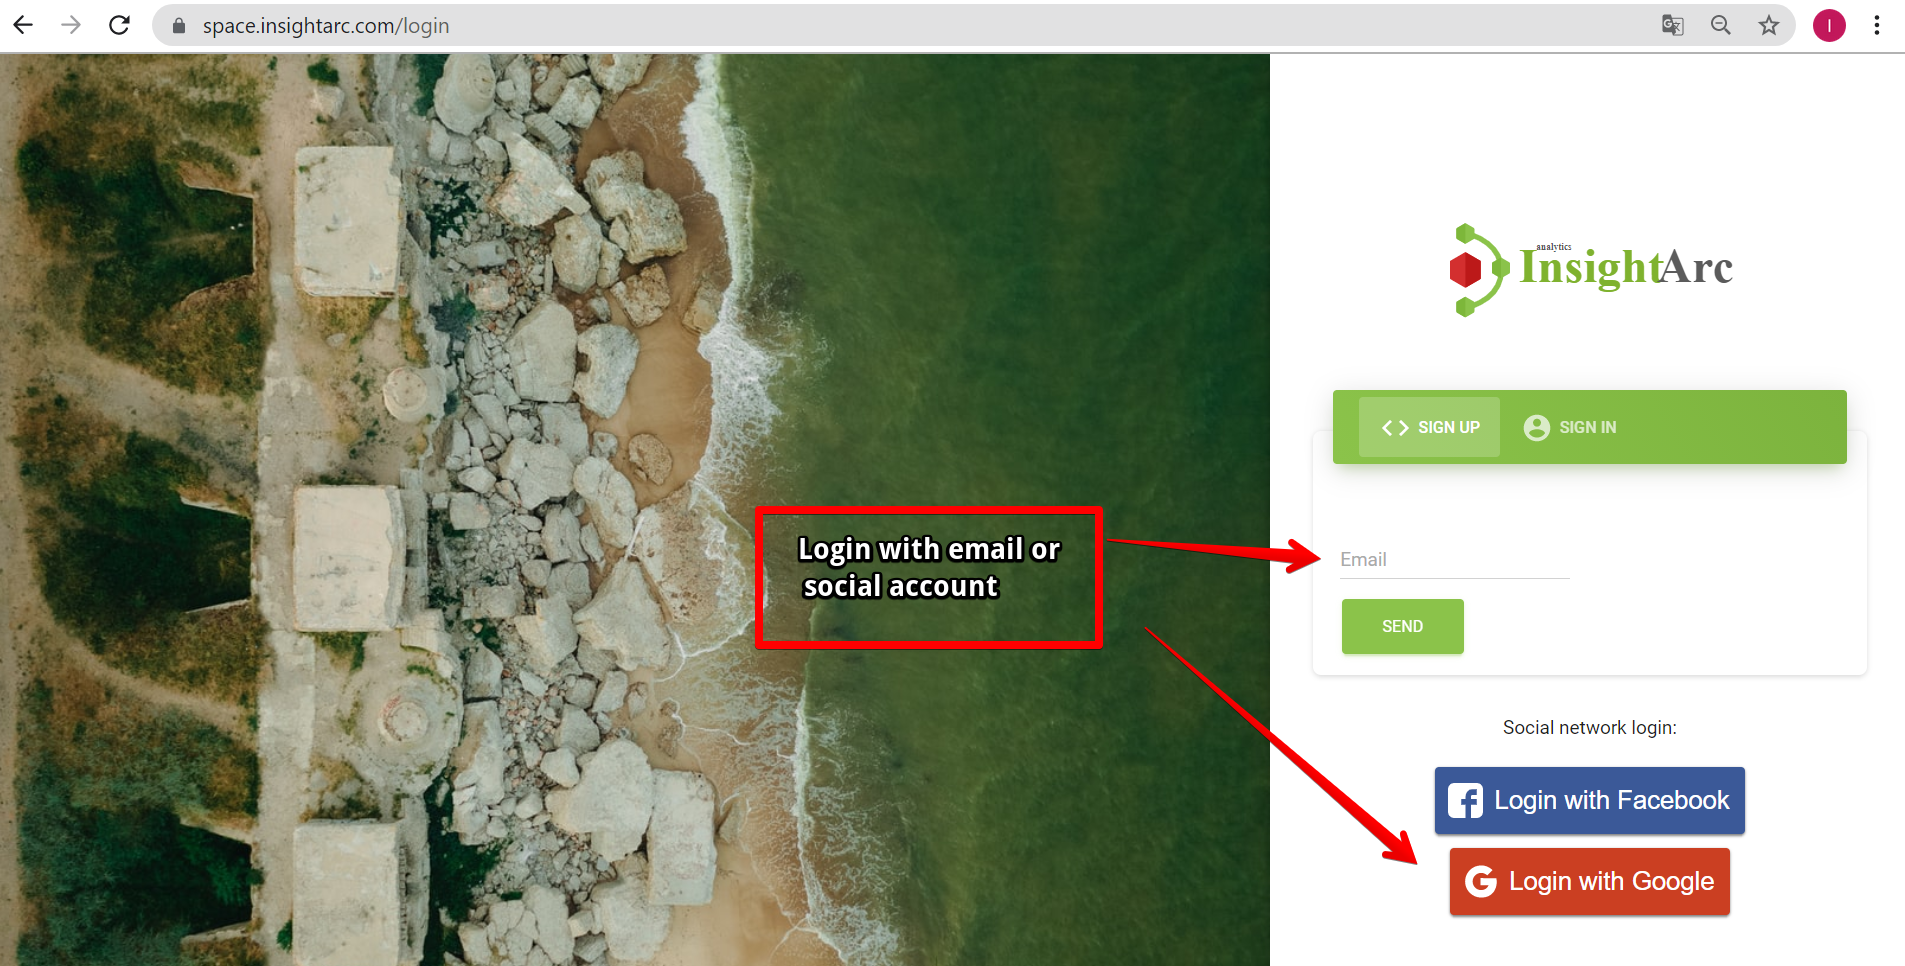
If you chose to sign up by email, you will receive an activation email. If the email is missed, please check the spam folder, as some firewalls block automated messages.
Also, make sure, your browser does not block links.
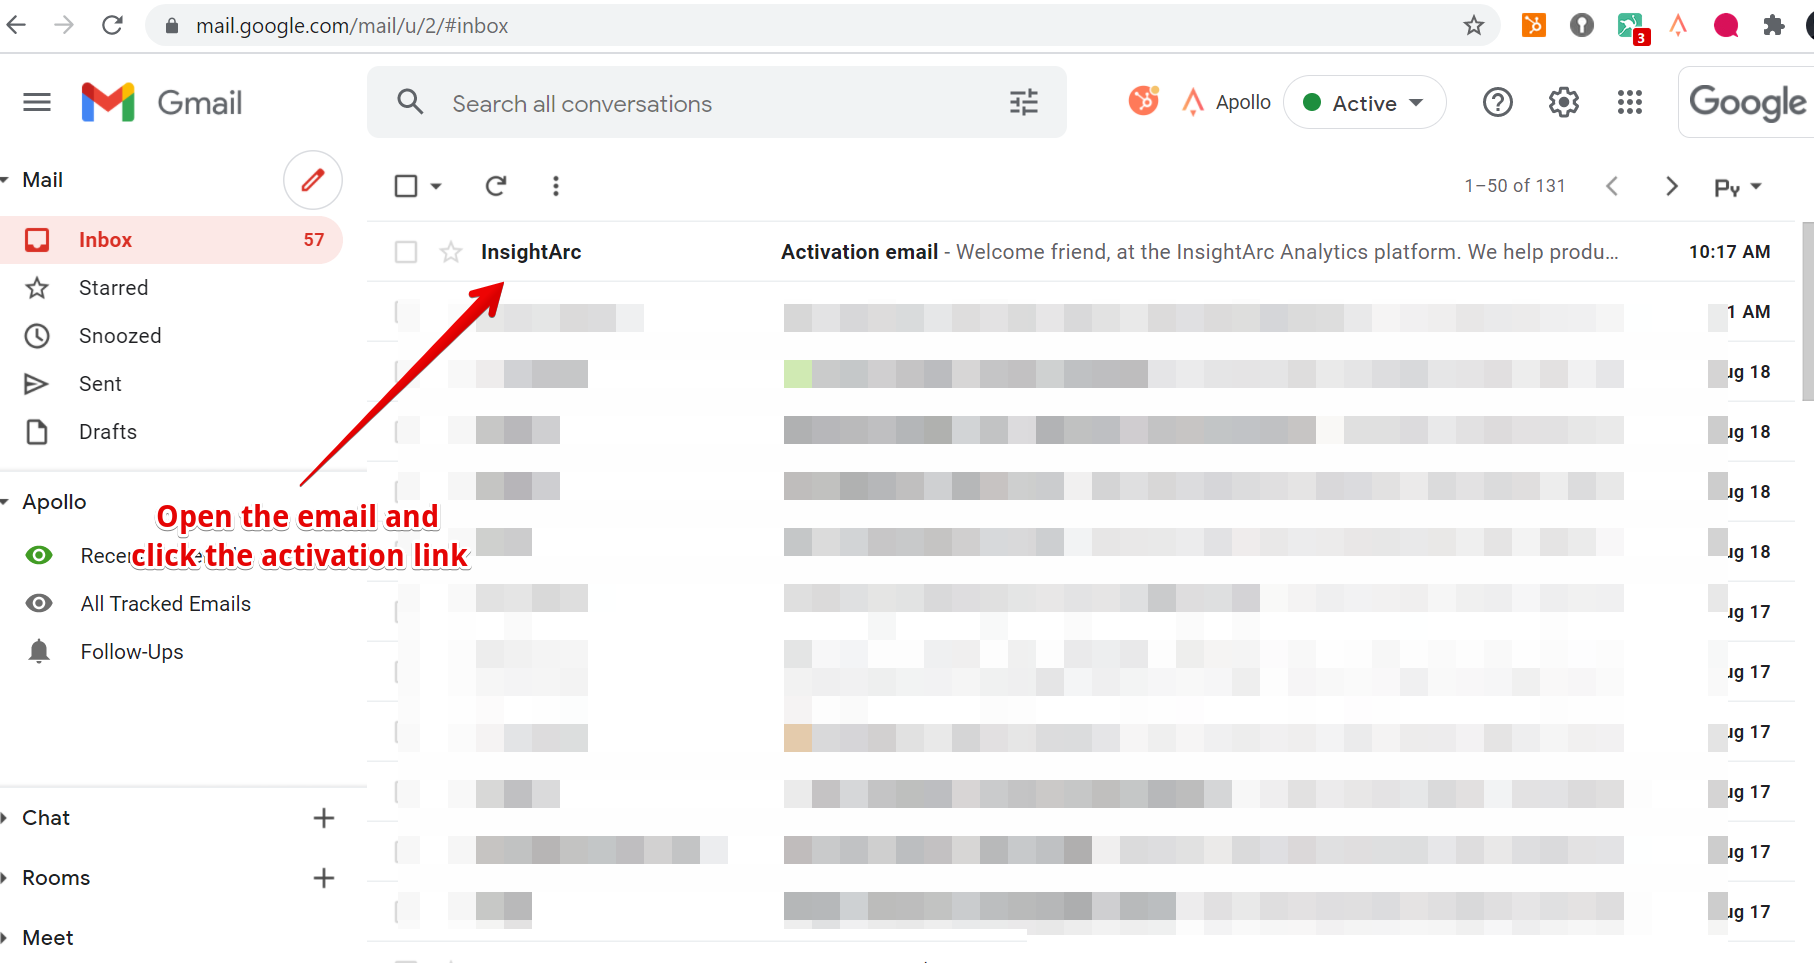
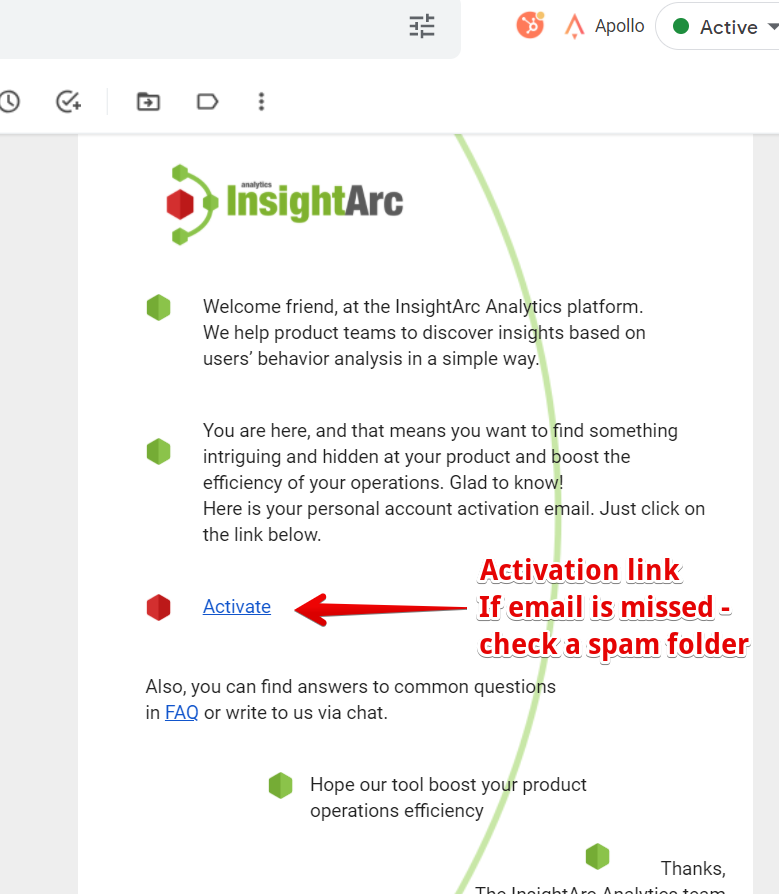
- Click the activation link. If you delay an activation link, the access token will expire. In that case, you will need to sign up one more time.
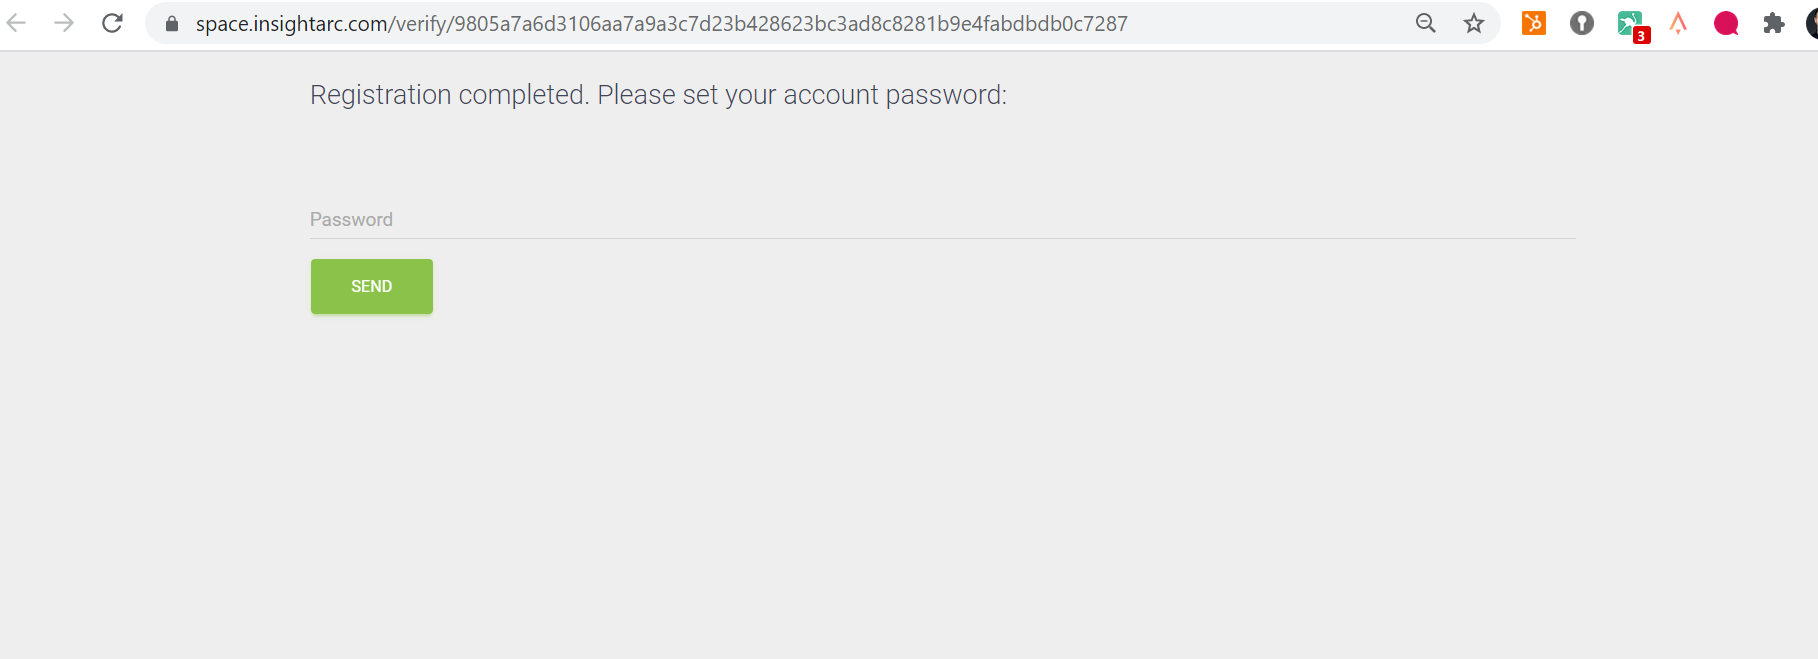
The next is to create a secure password. If you receive the notification of activation error - your security token has expired. In that case, you need to register again.
And now you got access to the Insightarc’s space.
Click the Processes button on the left side.
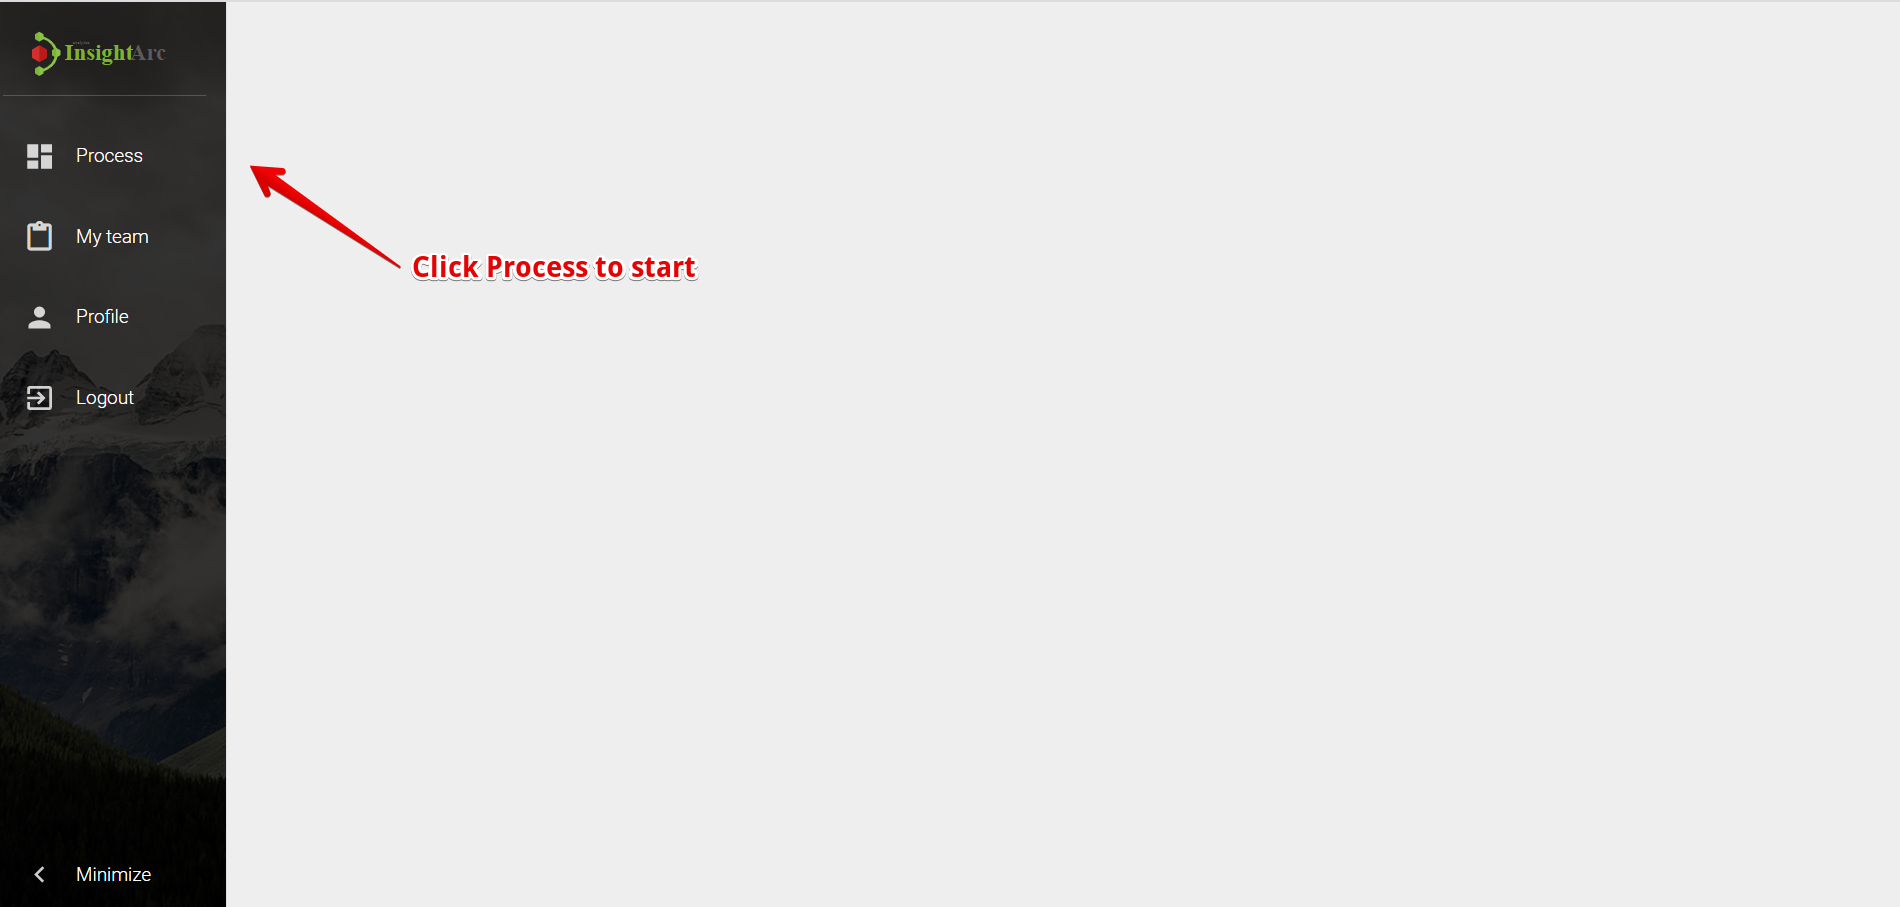
- This is the main interface of Insightarc, where you can upload data, review results, and work with customer journey analytics.
The graph you see the first time is a graph with synthetic data.
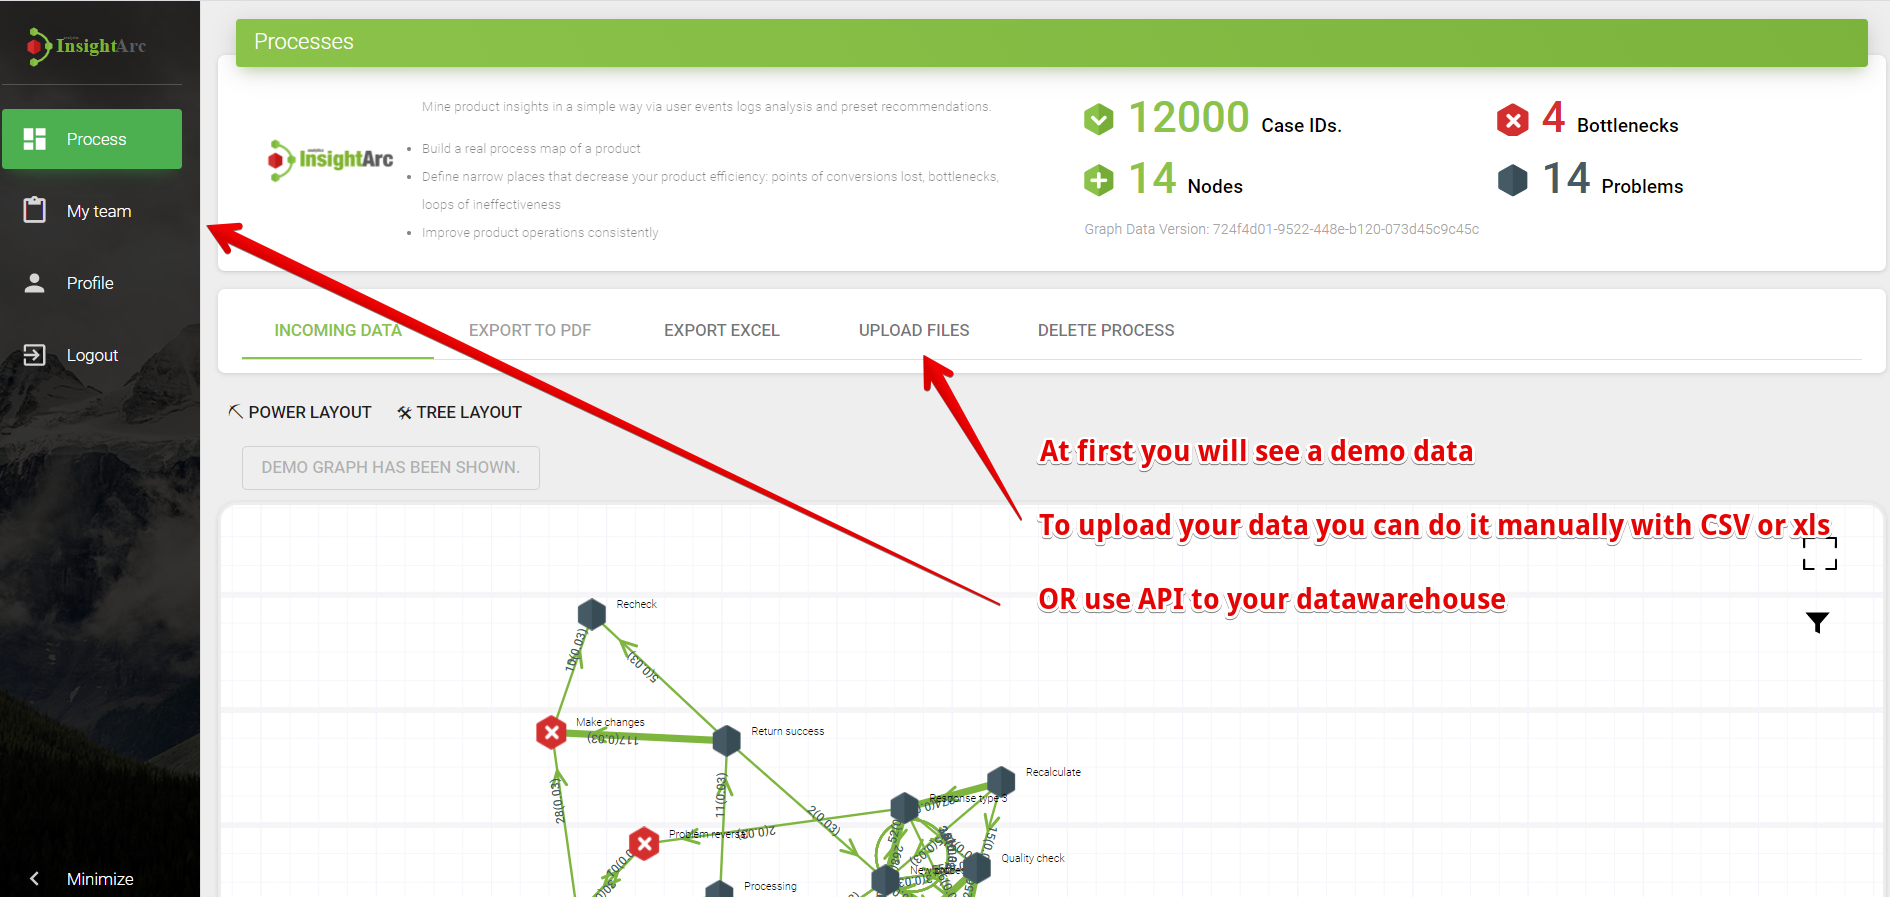
- Insightarc has two interfaces to upload user events.
Manual upload with CSV or XLS file via an interface. This is a free option and allows to work with 50 Mb data sets. In practice, it covers up to 20 000 user cases in an average ecommerce/ SaaS company.
Data streaming from data warehouse via API
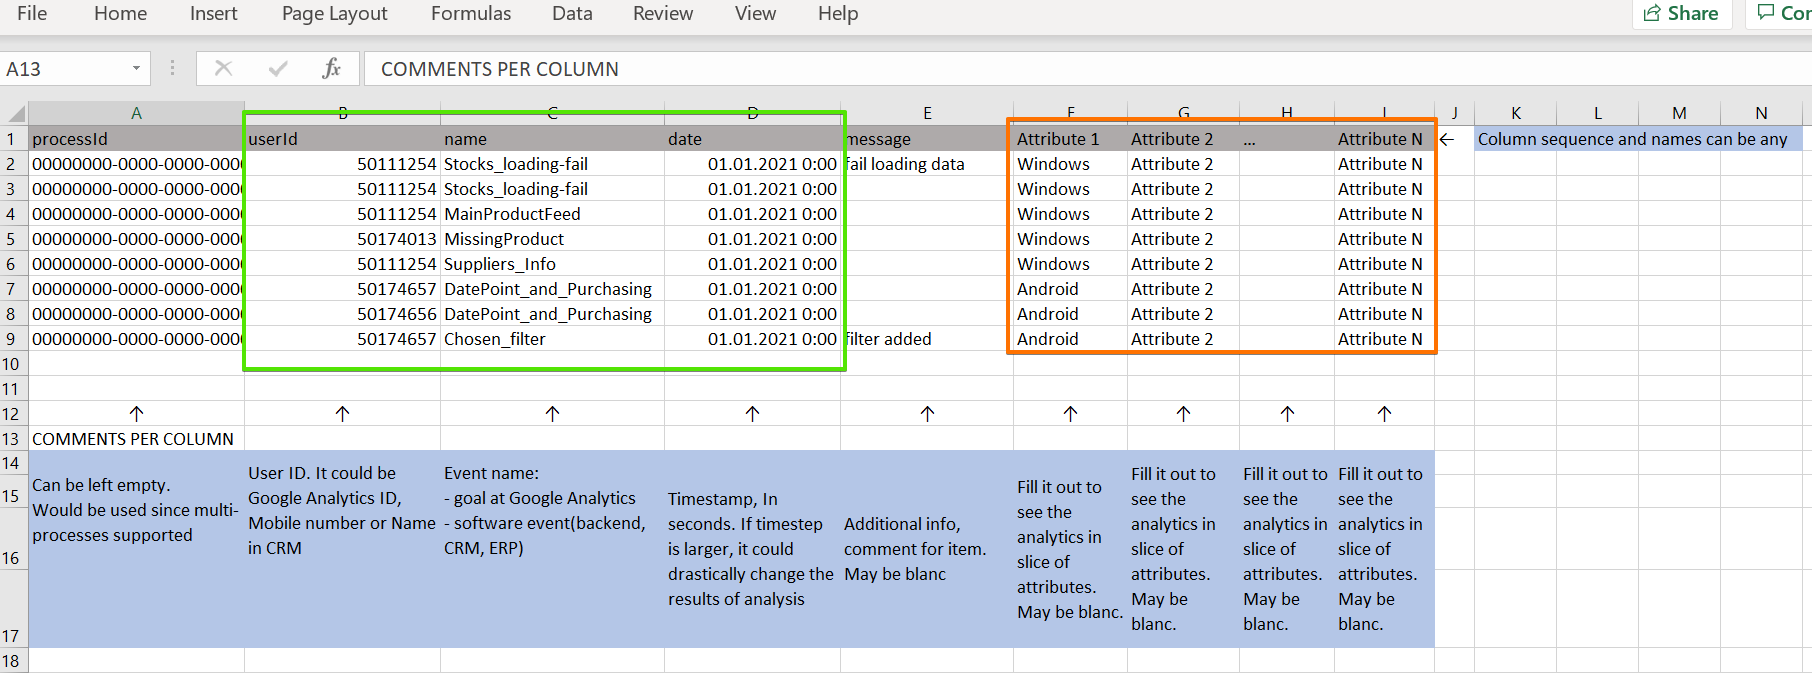
An example of a data set, that should be uploaded, attached next to the IMPORT button.
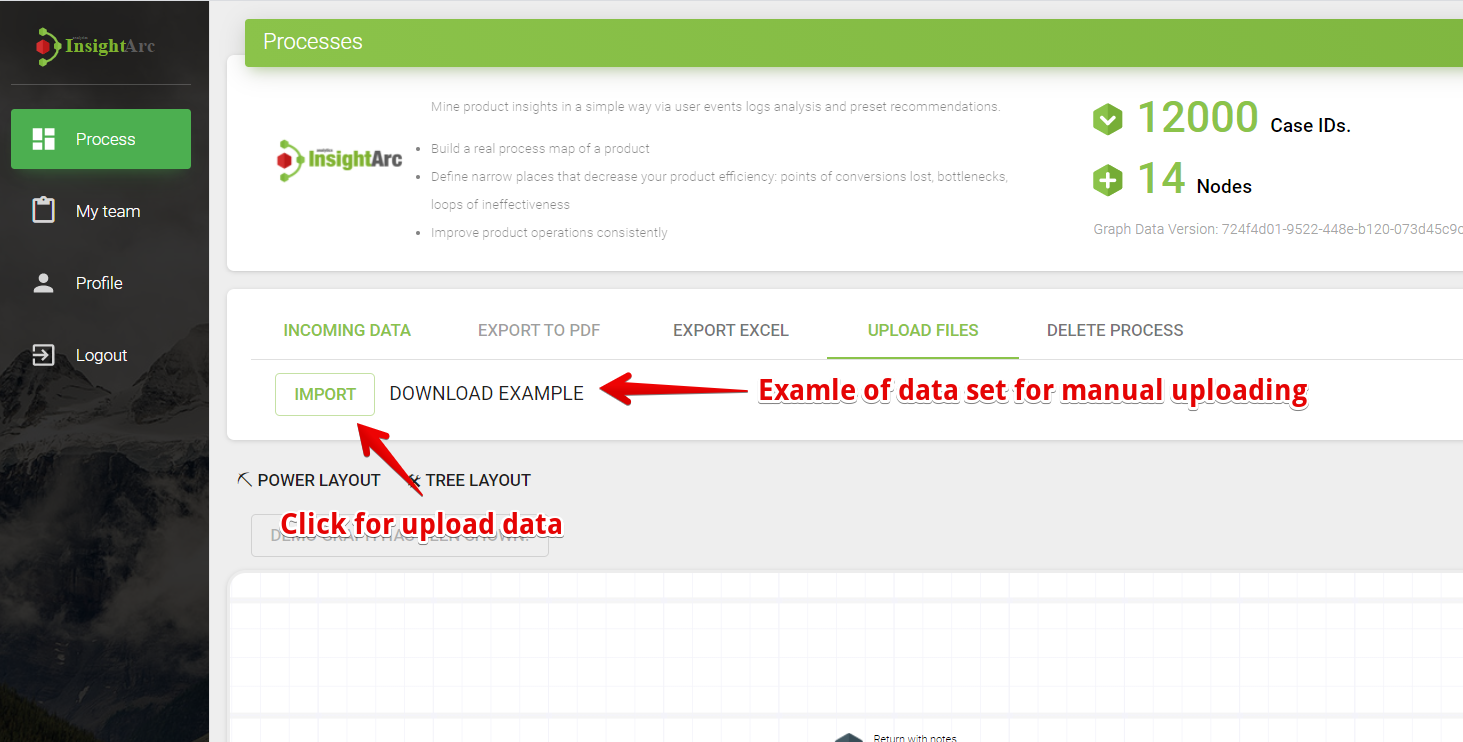
- Data-set for analysis can be uploaded directly via an interface.
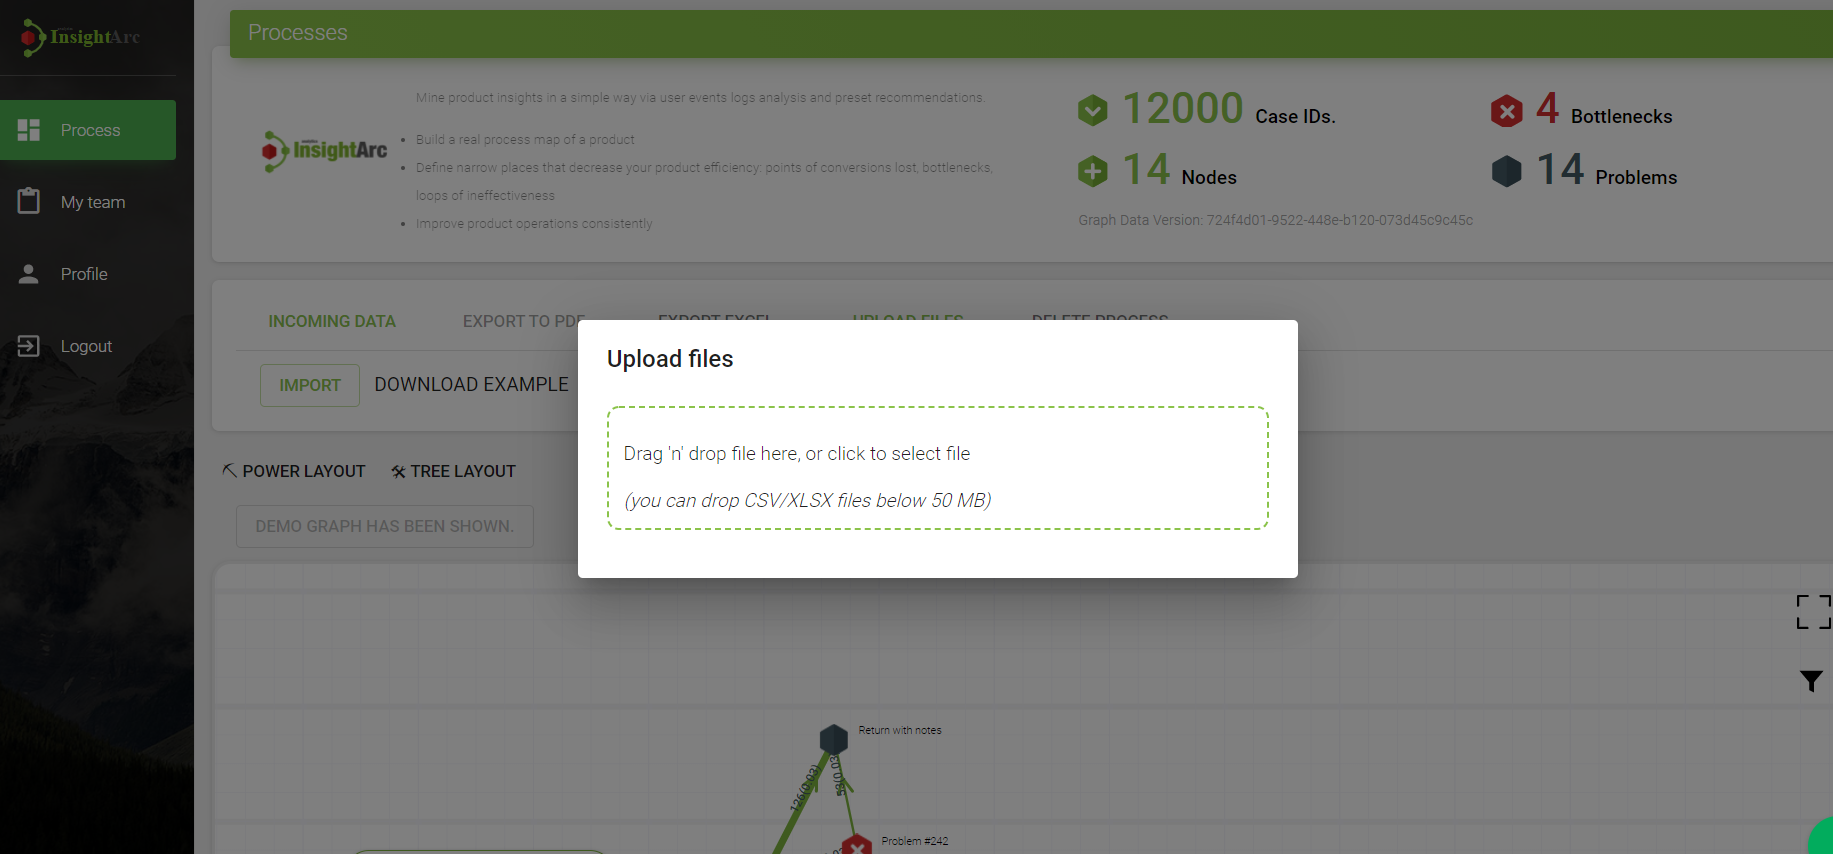
Any of data-set based on three components of user event:
User ID. Here could be used Google Analytics user identification or customer id from CRM.
Even name. It can be Google analytics goals or tasks from CRM, in case you want to see how CJM looks like after an order is placed in the CRM.
And Timestamp - the time when the user executed an action. For example, click on the order button in the online store, or submitted a call-back form.
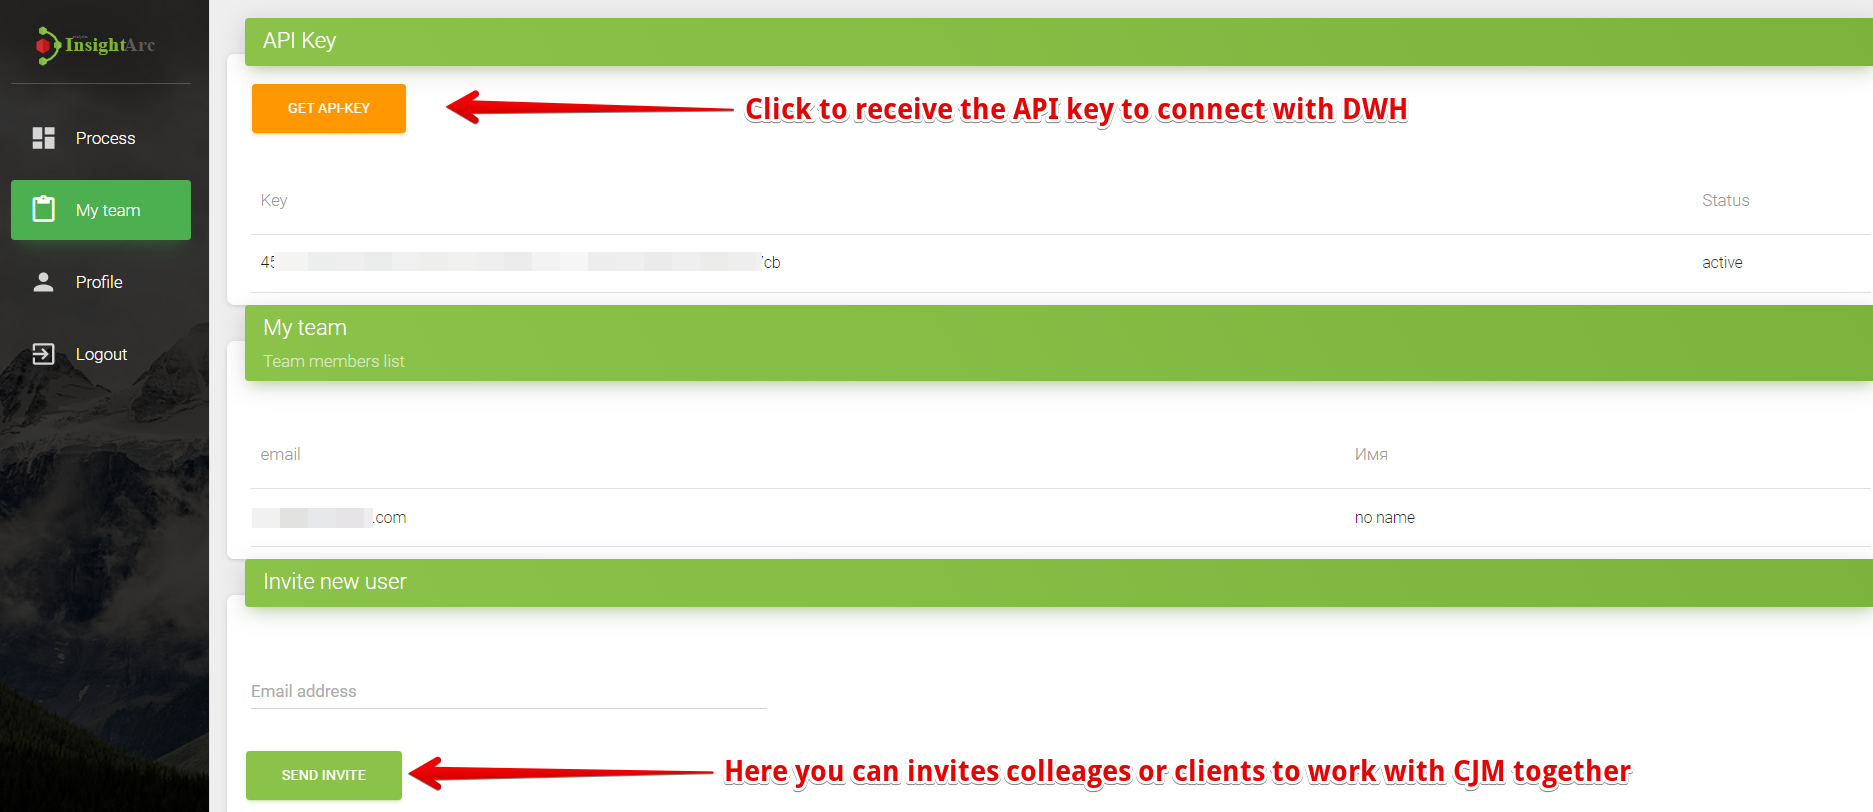
If you want to stream data sets over the 50Mb free limit, please connect your DWH via API. API key can be discovered in the My Team menu.
Here you can send an invite to your colleague or client to work together with customer journey insights.
Important points.
After uploading you need to wait for one hour before the results. Insightarc caches data to make your experience more comfortable.
Data can be uploaded in several bunches.
Insightarc automatically links data together in one data graph. But if data is set from different sources with different Names of events - the knowledge graph will be fragmented.
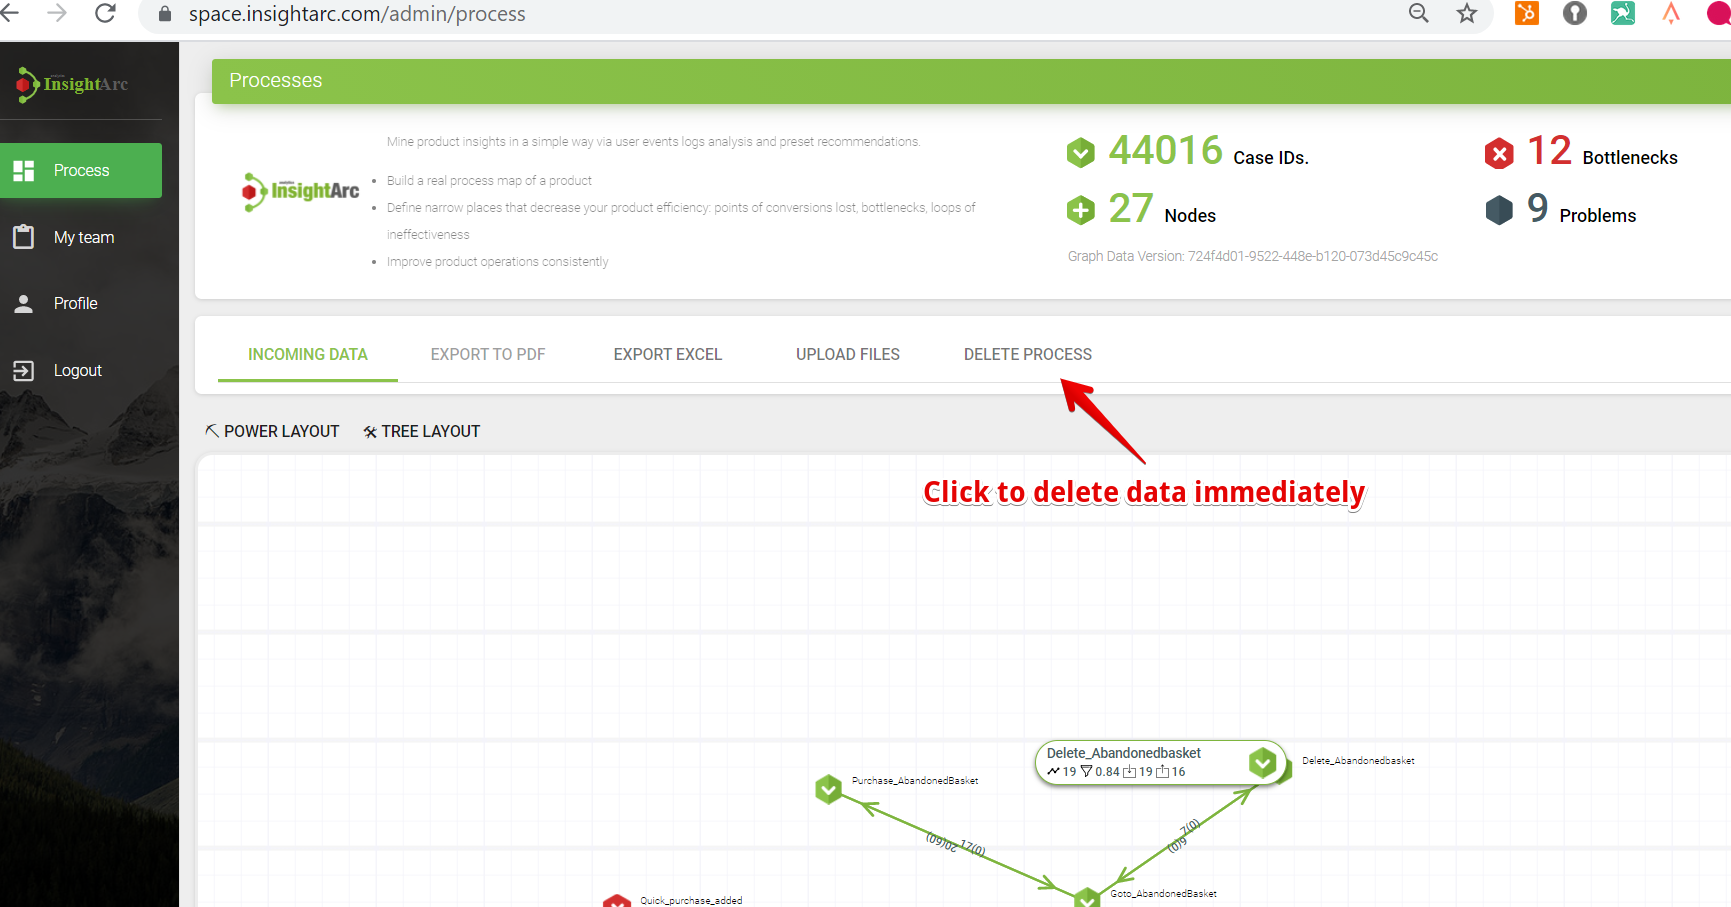
- If you want to delete data and upload the new set
Find in the next guide
insights that can be discovered in user data